

Wakefield or affectionately known as “Shaky Wakey” is home of the Yorkshire
Sculpture Park, National Coal Mining Museum and the Westgate Run! With a
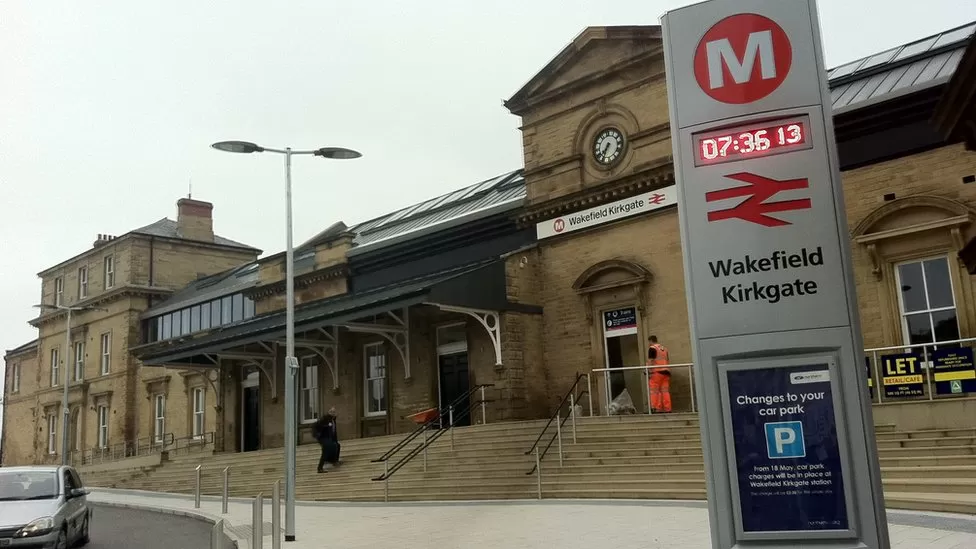
population of just under 500,000 and its amazing transport hubs to all
major cities in the UK, Wakefield is a great location to live in. With
major investments in to new houses throughout the Borough there is an
ever-increasing population. So, if you are thinking of moving into
Wakefield its worth considering what areas are most affected by criminal
behaviour! We have ranked the 21 areas from WORST to BEST to help new
people coming to the area!
We’ll look at what types of crime for each area, providing you with key facts to help
inform you of moving your home or business.
How did we rank the areas?
Frontline Security scoured our information from various open-source information complied evidence on West Yorkshire Police’s crime reports. All the crime data will be explained as a ratio of crimes per 1000 people living in each area for 2022.
The areas are broken down by the Wards of Wakefield which is available to view on Wakefield Council’s Website.
What is the Wakefield Crime Rate?
Wakefield’s Crime rating is classed as – high and is ranked 5th out of 25 nearby
boroughs/local administrative districts for crime rate. In 2022, there were 51322 incidents of crime reported. As per the last census Wakefield’s population was 353,370 this equates to a crime rate of 145.24 per 1000 residents. This crime rate represents an increase of 9.72 % compared to 2021.
Wakefield’s most common crime types in Wakefield are:
Violence and sexual offences (41.8%)
Public order (12.7%)
Criminal damage and arson (8.3%)
Wakefield least common crime types are:
Robbery (0.7%)
Possession of weapons (0.6%)
Bicycle theft (0.5%).
Area Rankings by Crime Rate (per 1000):
#21 – Wakefield North = 290.6
#20 – Castleford Central & Glasshoughton = 230.5
#19 – Wakefield East = 213.2
#18 – Wakefield West = 205.8
#17 – Pontefract North = 194.9
#16 – Knottingley = 186.0
#15 – South Elmsall & South Kirby = 164.0
#14 – Altofts & Whitwood = 157.9
#13 – Airedale & Ferry Fryston = 156.8
#12 – Hemsworth = 151.1
#11 – Normanton = 127.8
#10 – Featherstone = 116.4
#9 – Wakefield South = 113.0
#8 – Ossett = 105.0
#7 – Pontefract South = 104.2
#6 – Ackworth, North Elmsall and Upton = 93.3
#5 – Wrenthorpe & Outwood West = 92.4
#4 – Horbury & South Ossett = 86.2
#3 – Stanley & Outwood East = 84.2
#2 – Wakefield Rural = 78.3
#1 – Crofton, Ryhill & Walton = 75.8